
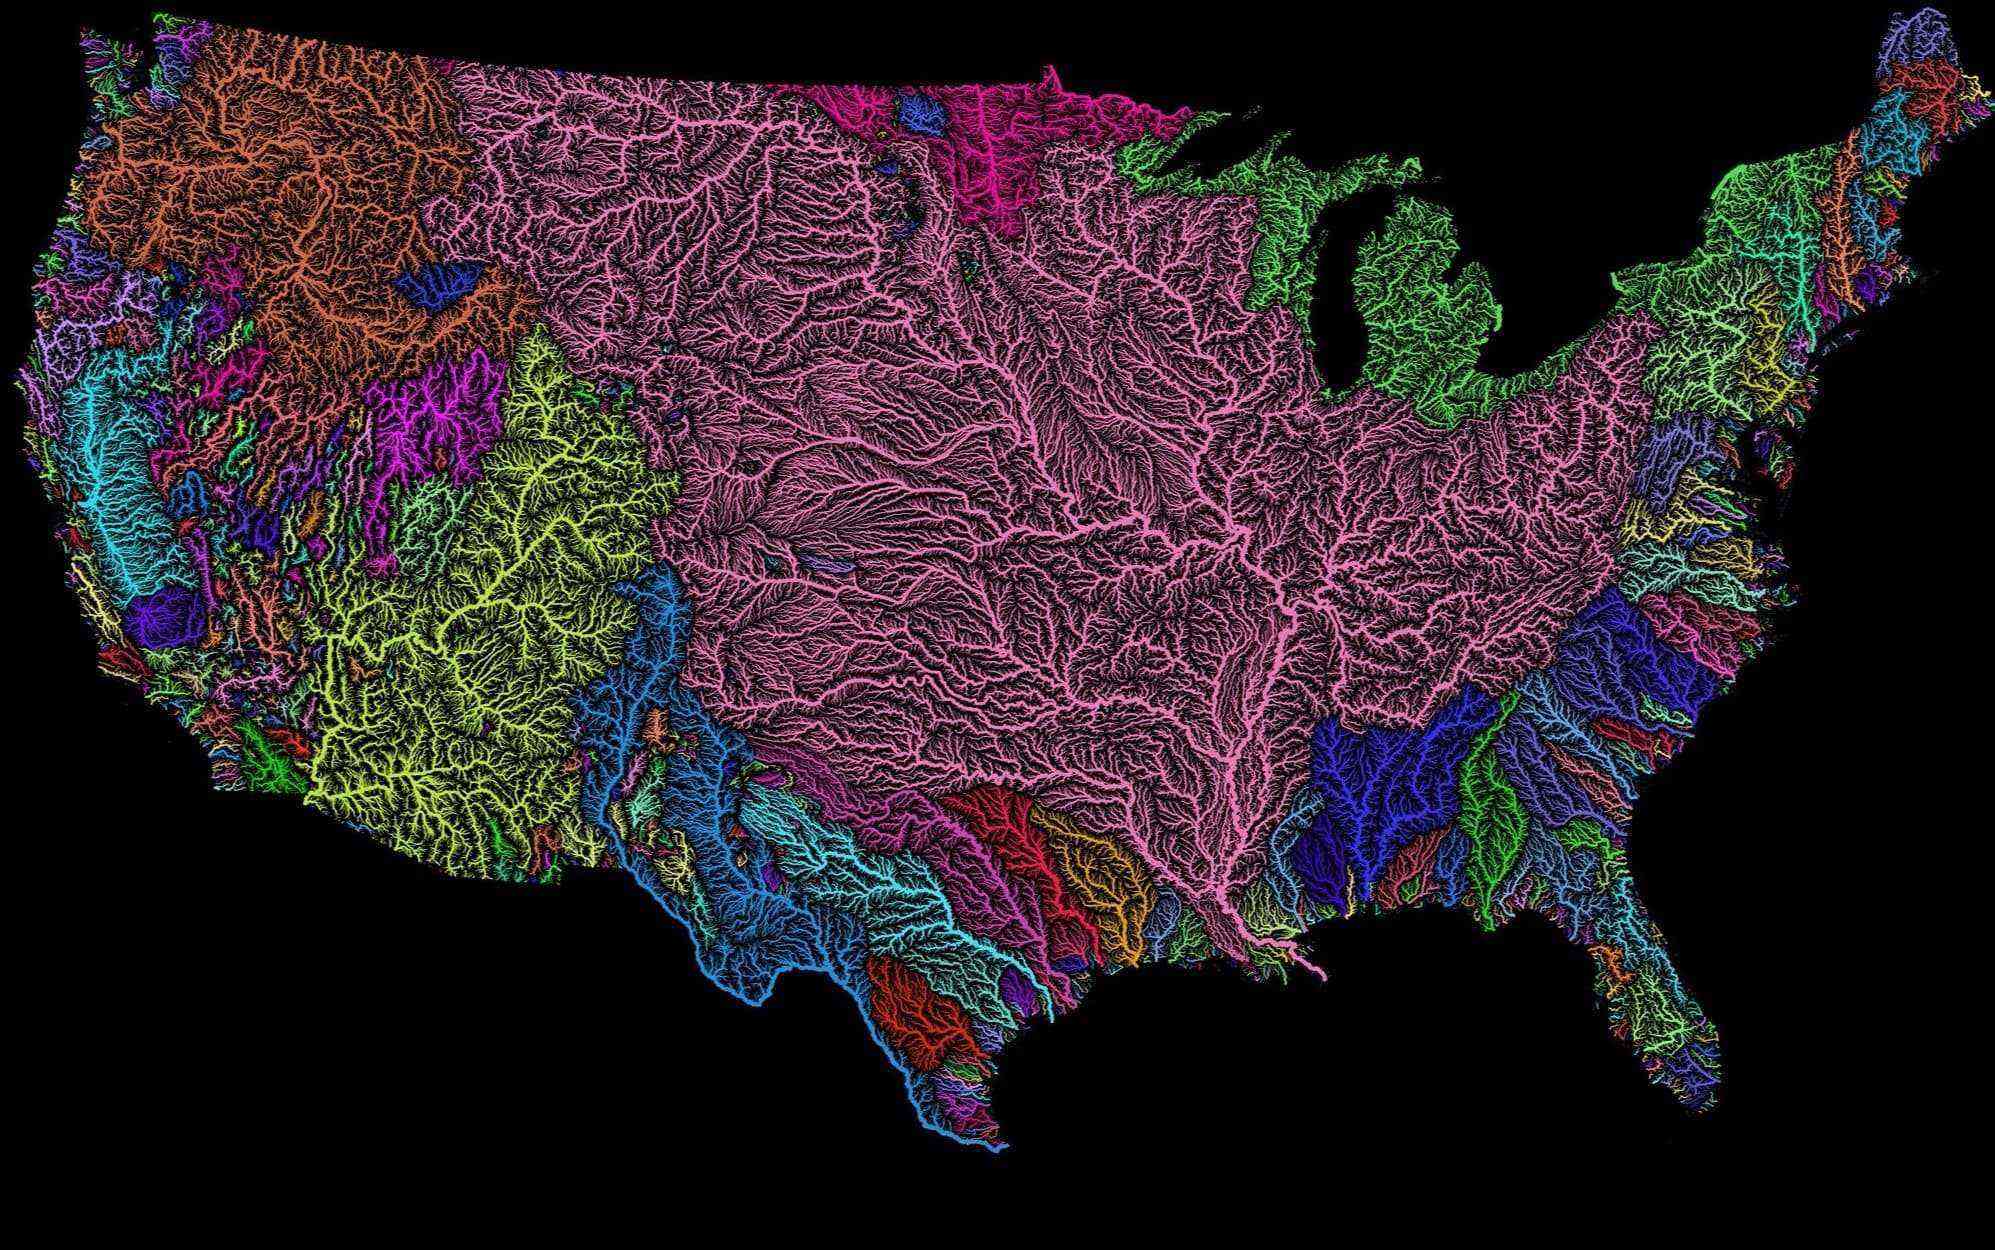
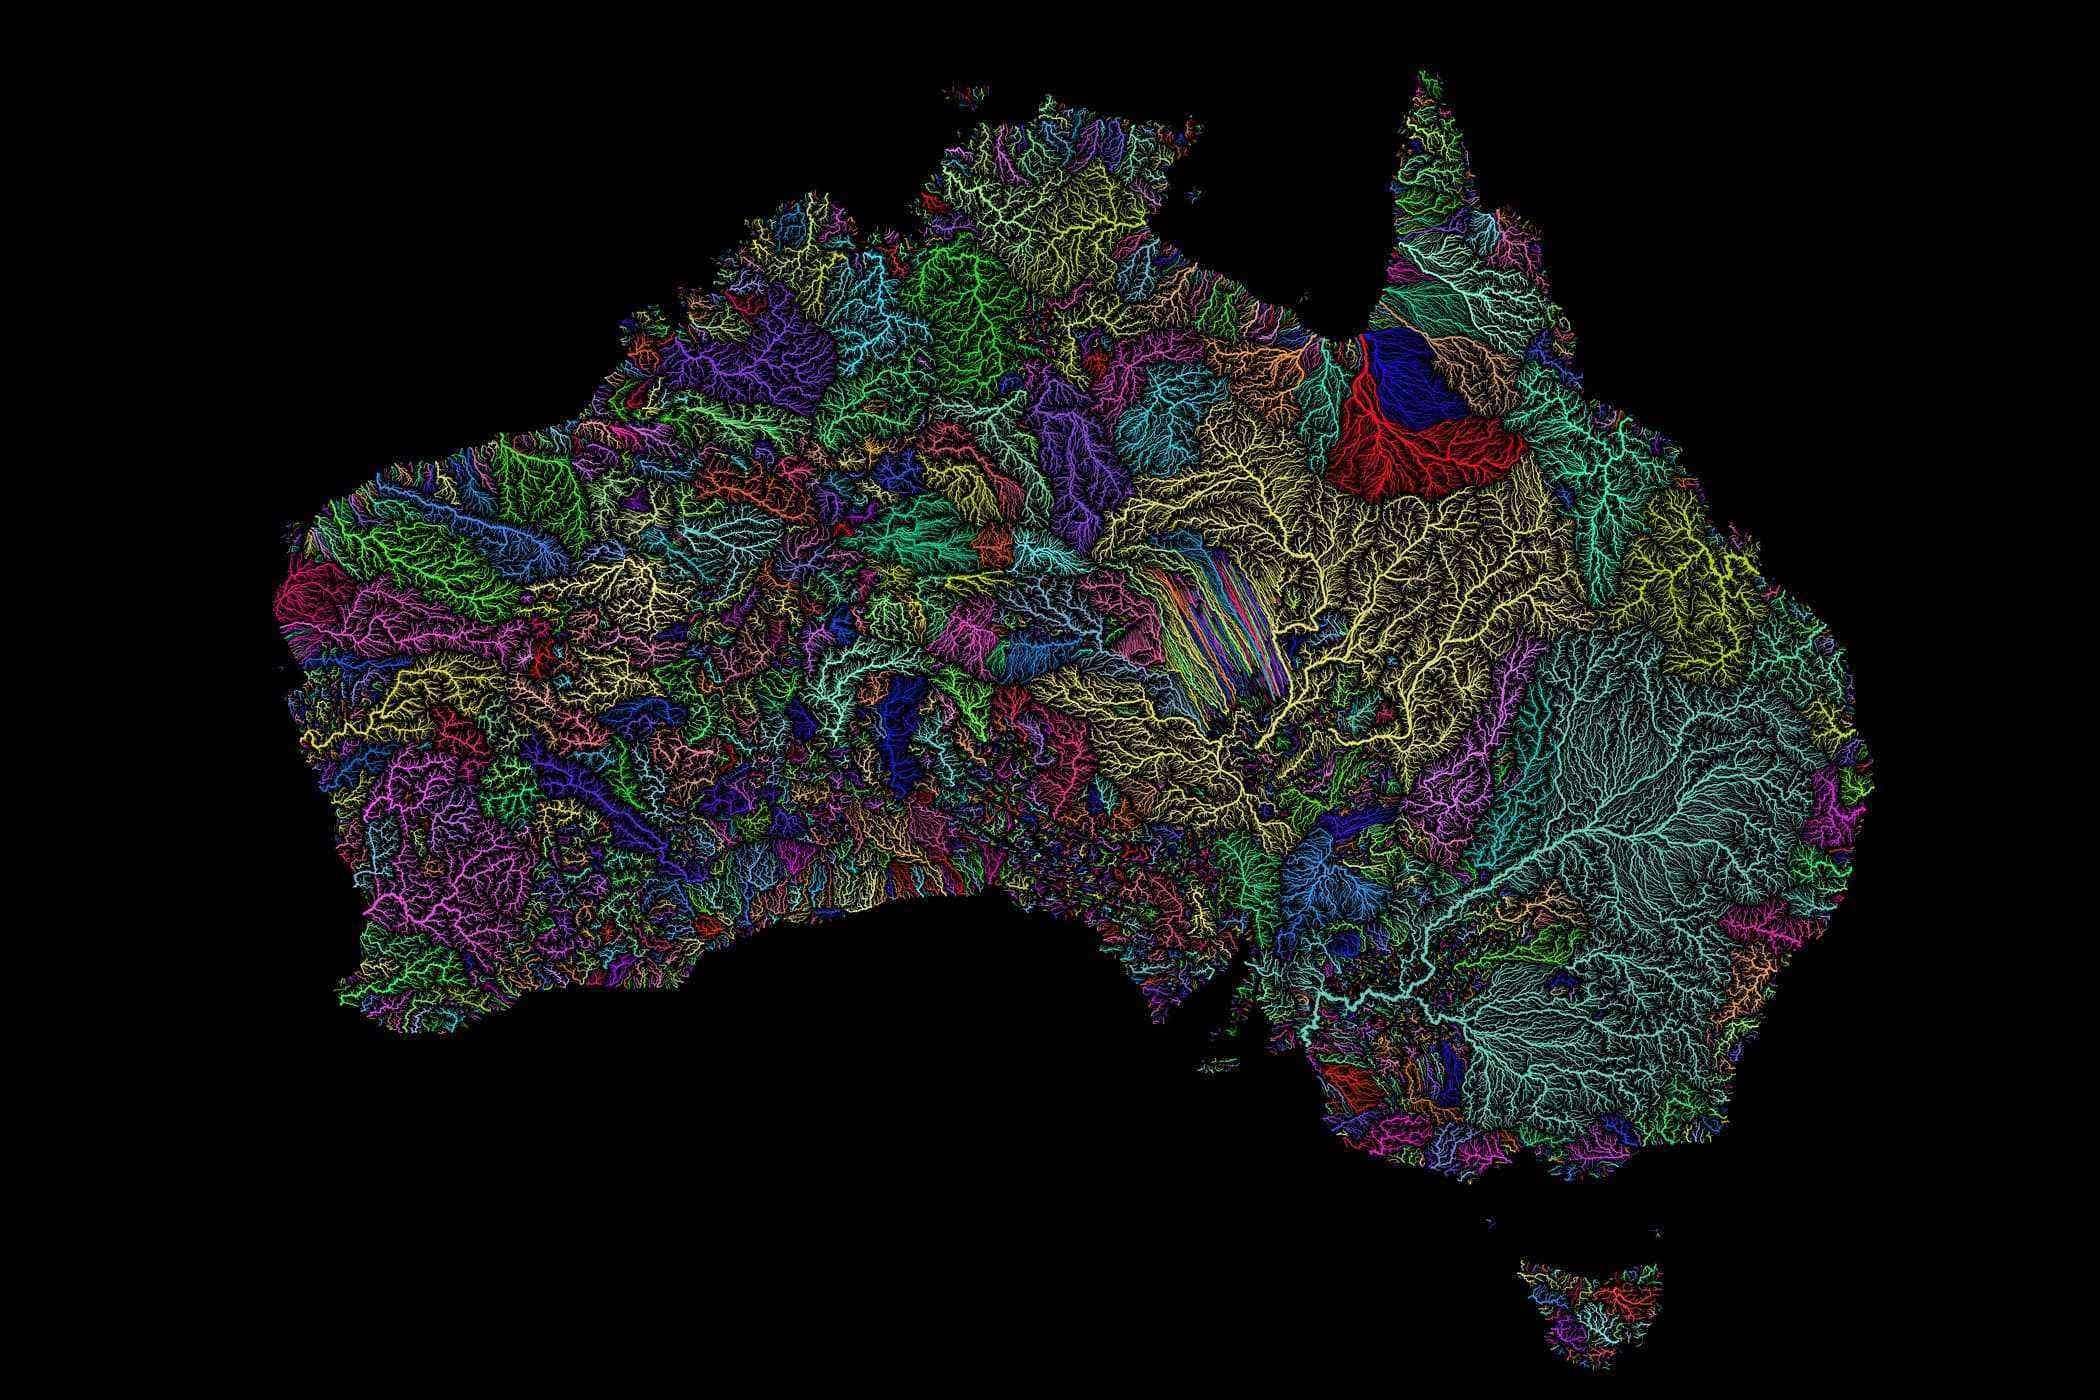
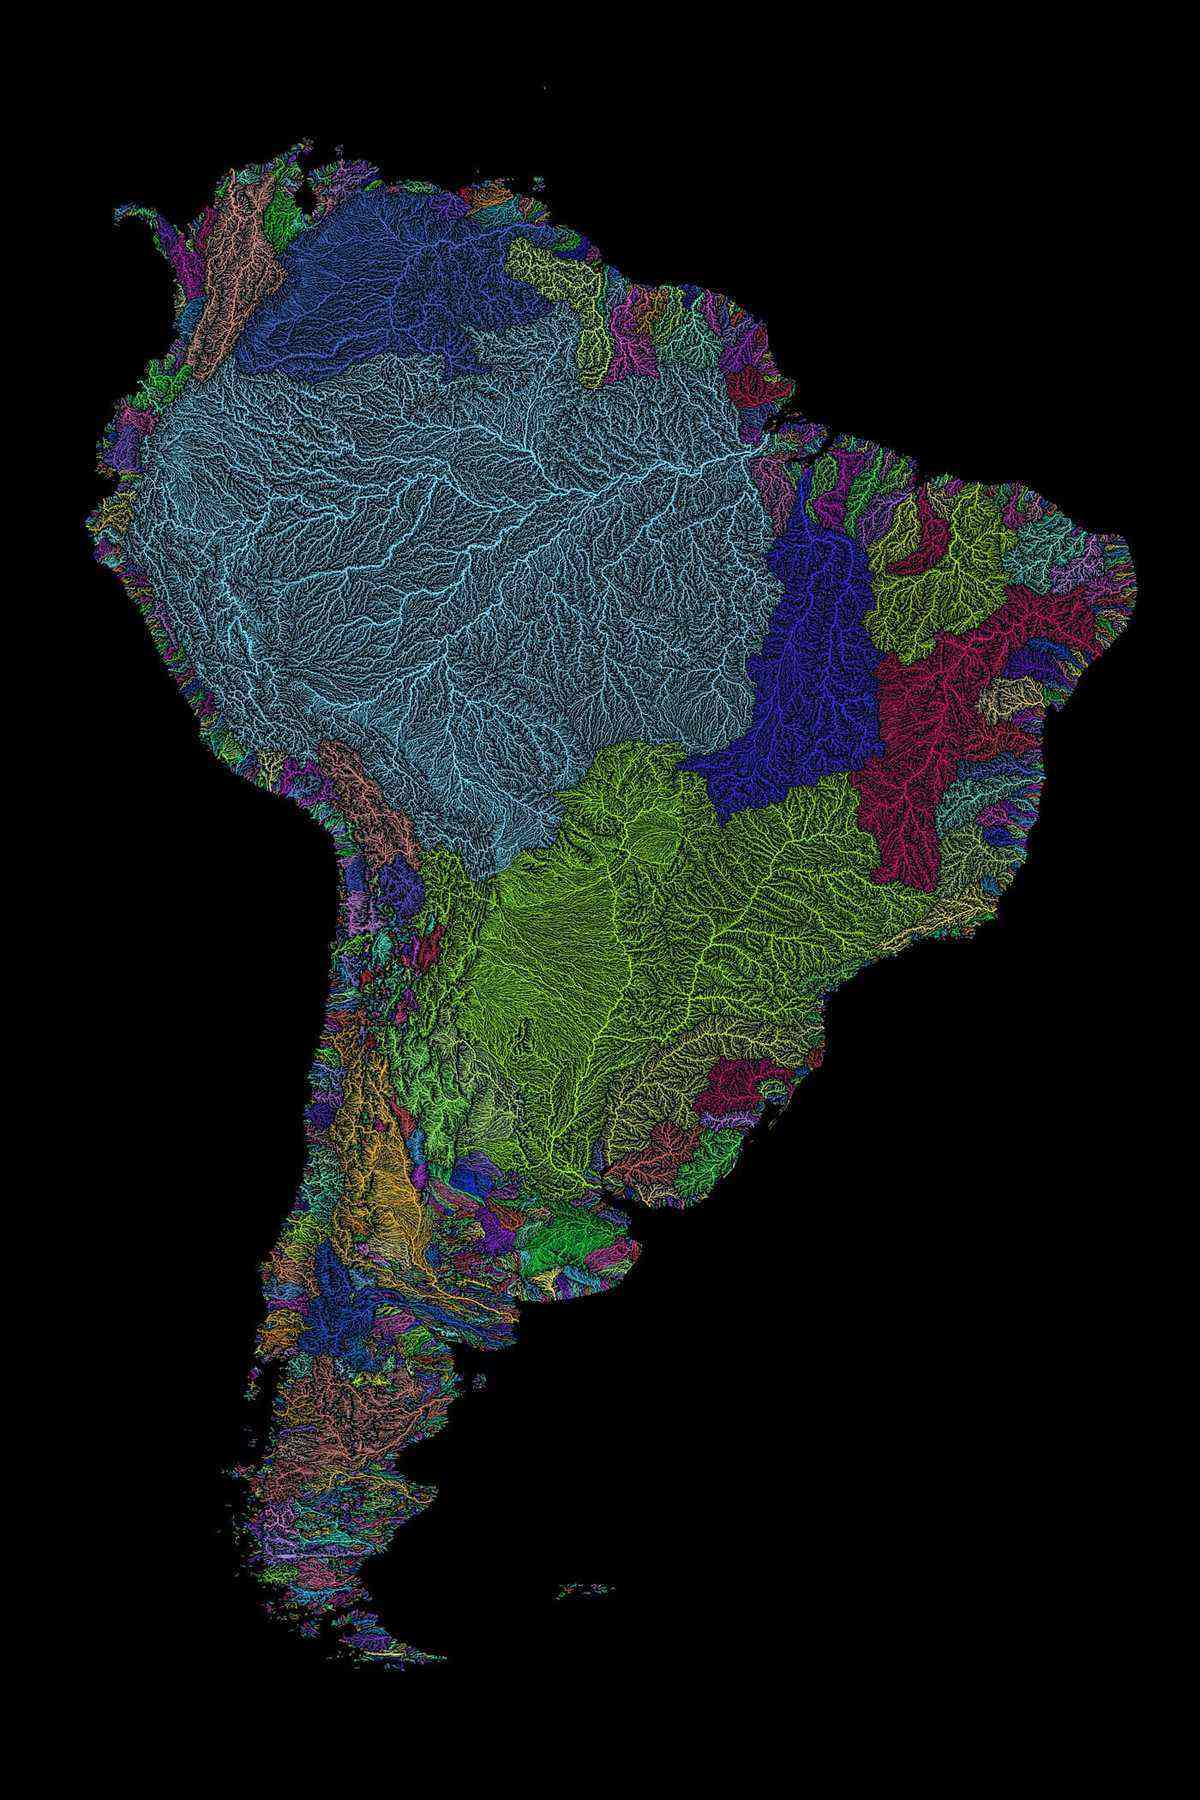
The technicolor lines highlight the expanse of freshwater tributaries across the world.
Cartographer Robert Szucs, aka Grasshopper Geography, is showcasing his love of nature’s patterns in a new crop of art work illustrating the rivers of the world.
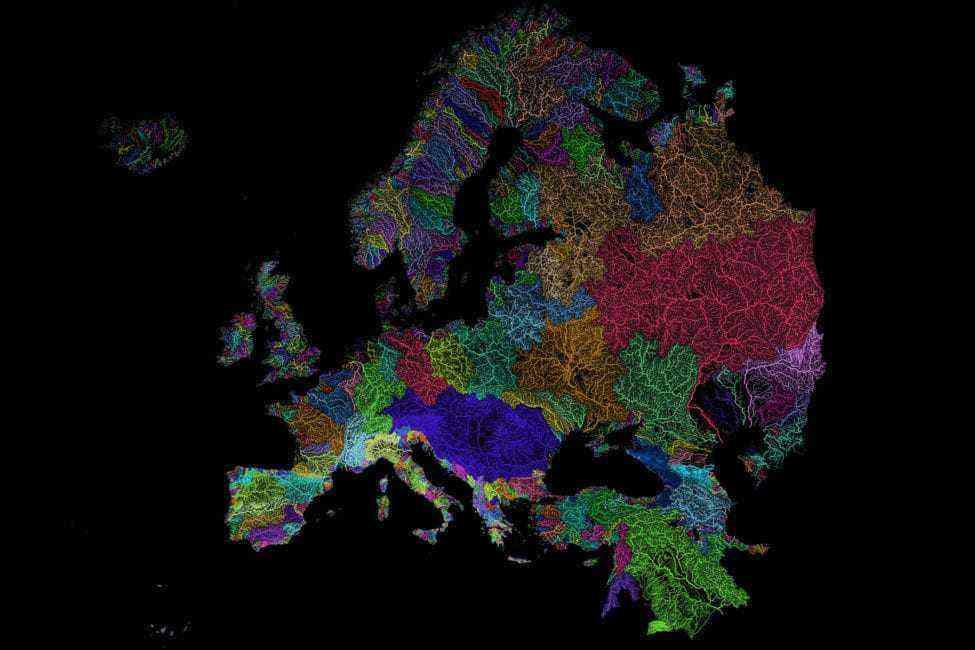
“I created the design, the colors, the width of the lines. But I did not draw any of the lines,” says Szucs.
As cartographer by profession, Szucs utlizies an open-source geographic system called QGIS to source his data. Graphic editong software helps him to create the intriguing widths of colors that make up regional watersheds and basins.
“It’s all 100% scientific, based on satellite data and digital elevation models,” he says. “Every stream and river is placed on a scale of 1-10, based on the stream order (size).”

The 31-year-old Szucs used to work as a geographic information systems (GIS) analyst but parlayed his skills into GIS art and design. The rivers particularly fascinate him “because they are amazing. “I mean, look at my US river map–I created the design, the colors, the width of the lines. But I did not draw any of the lines.”
“It’s nature’s amazing work. I just found a way to show it in a new way, a fitting way.”